

This is a demonstration of our new Analytics capability, which is part of our 20.2 release.
This demonstration will show you how easy it is to create a useful and visually compelling dashboard specifically, in this case, to help with team coordination.
We will build this dashboard in 10 minutes, stopping here and there to explain some of the capabilities and concepts.
We believe your team can take on the task of building their own uniquely useful dashboard views into your case data.
So how does Analytics help your team?
Analytics give them the ability to:
- Prove your team’s value to the organization.
- To create greater efficiencies by analyzing performance.
- To track Compliance by examining the data you can easily capture on compliance KPIs
- To improve referrals to your unit by examining past cases referred vs case outcomes and savings.
- To measure quality by creating dashboards to measure the quality of work our vendors and team are doing
So, what did we just see?
The dashboard build took around 10 minutes with stops to explain some of the concepts.
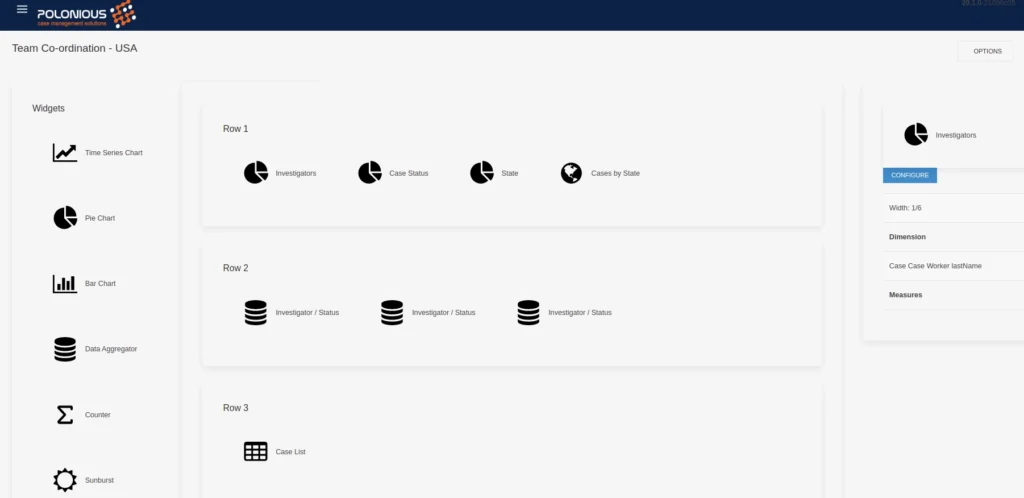
I think you will agree, it was easy to drag, drop and construct this dashboard.
We believe you can do this task now with no IT involvement required. This is a big saving in doing time, turnaround time and internal costs.
So what did we just see in terms of Polonious Analytics capability?
You can easily filter and select the case data you need to answer your questions.
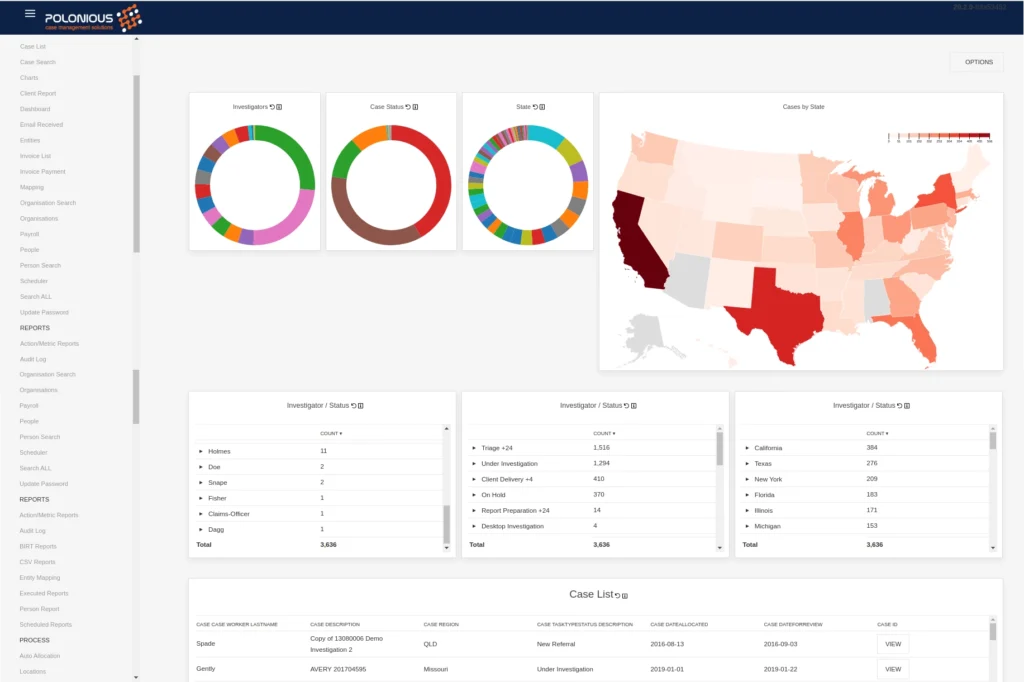
There are a bunch of smart widgets to visualise your data as you need.
When you are using the dashboards, if you see something interesting, it’s very easy to drill down to that detail and see all cases in a list represented by that point of interest.
You can view a case straight out of that filtered list to see the full detail of what went on during that individual case.
What else can we do with this new capability? What are the other possibilities?
Rick Shepherd and Steve Epstein of Polonious gave a metrics presentation at IASIU on the key areas analytics help a team such as yours. Proving Value, Improving Referrals, Creating Efficiencies, Measuring Quality and Compliance. All of these are now easy to create with Polonious Analytics..
We hope you enjoy our new 20.2 release. We really look forward to seeing what your team are able to put together with this new capability.
If you have any questions or improvement suggestions, we are very keen to hear from you. Thank you.
Let's Get Started
Interested in learning more about how Polonious can help?
Get a free consultation or demo with one of our experts